Radar chart 구현
설치하기
npm install react-chartjs-2 chart.js
import 하기
import {
Chart as ChartJS,
RadialLinearScale,
PointElement,
LineElement,
Filler,
Tooltip,
Legend,
} from "chart.js";
import { Radar } from "react-chartjs-2";
Data set
export const data = {
labels: [
"가",
"나",
"다",
"라",
"마",
"바",
],
datasets: [
{
label: "그램그램",
data: [1, 1, 1, 1, 1, 1],
fill: true, // 선 안쪽 색상 채워짐
backgroundColor: "rgba(98, 181, 255, 0.2)",
borderColor: "#377EF8",
pointRadius: 0,
pointHoverBackgroundColor: "#fff",
pointHoverBorderColor: "#377EF8",
},
],
};
Option set
const options = {
responsive: false,
scales: {
r: {
grid: {
circular: true,
},
pointLabels: {
font: {
size: 13,
},
color: [
"#A6A6A6",
"#A6A6A6",
"#A6A6A6",
"#A6A6A6",
"#A6A6A6",
"#A6A6A6",
],
},
},
},
scale: {
beginAtZero: true,
max: 3,
min: 0,
stepSize: 1,
},
plugins: { //꼭다리
legend: {
display: false,
},
},
elements: { //차트요소 설정
line: {
borderWidth: 1, //선의 굵기
//tension: 3, //선의 굴곡 비율
},
},
};
전체코드
import React from "react";
import {
Chart as ChartJS,
RadialLinearScale,
PointElement,
LineElement,
Filler,
Tooltip,
Legend,
} from "chart.js";
import { Radar } from "react-chartjs-2";
ChartJS.register(
RadialLinearScale,
PointElement,
LineElement,
Filler,
Tooltip,
Legend
);
export const data = {
labels: ["가", "나", "다", "라", "마", "바"],
datasets: [
{
label: "그램그램",
data: [1, 1, 1, 1, 1, 1],
fill: true, // 선 안쪽 색상 채워짐
backgroundColor: "rgba(98, 181, 255, 0.2)",
borderColor: "#377EF8",
pointRadius: 0,
pointHoverBackgroundColor: "#fff",
pointHoverBorderColor: "#377EF8",
},
],
};
const options = {
responsive: false,
scales: {
r: {
grid: {
circular: true,
},
pointLabels: {
font: {
size: 13,
},
color: [
"#A6A6A6",
"#A6A6A6",
"#A6A6A6",
"#A6A6A6",
"#A6A6A6",
"#A6A6A6",
],
},
},
},
scale: {
beginAtZero: true,
max: 3,
min: 0,
stepSize: 1,
},
plugins: {
//꼭다리
legend: {
display: false,
},
},
elements: {
//차트요소 설정
line: {
borderWidth: 1, //선의 굵기
//tension: 3, //선의 굴곡 비율
},
},
};
export default function App() {
return <Radar data={data} options={options} width={500} height={500} />;
}
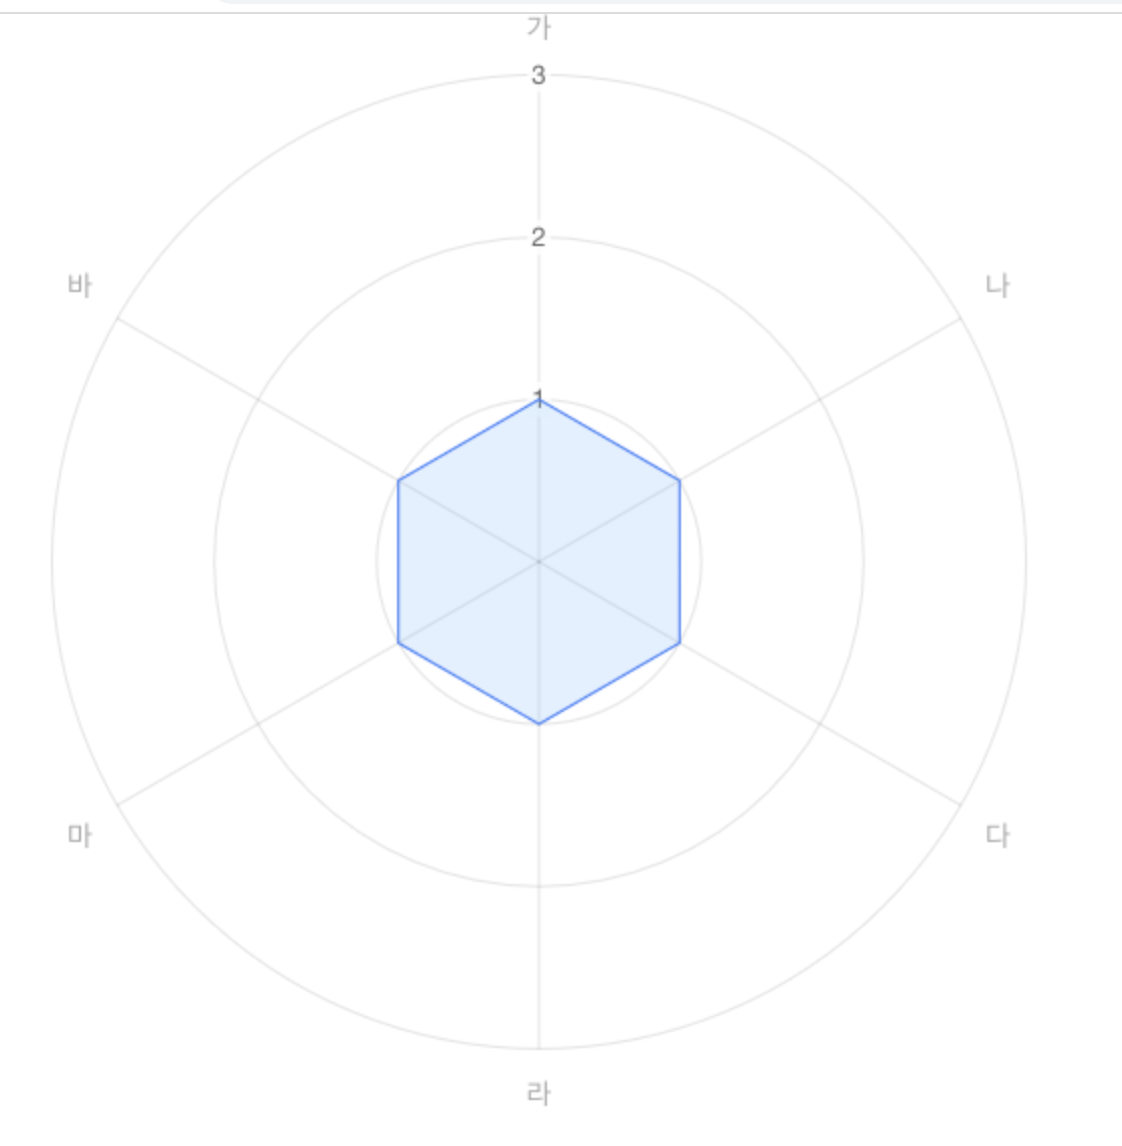
결과물
'프론트엔드 > 리액트' 카테고리의 다른 글
| 리액트로 도넛모양차트 하이차트, +annotation 옵션 구현 (0) | 2023.04.13 |
|---|---|
| 리액트로 이미지 다운로드(html-to-image) (0) | 2023.04.10 |
| Mac에서 nginx로 리액트 배포 (0) | 2023.04.03 |
| useQuery에서 staleTime과 keepPreviousData 차이 (0) | 2023.03.06 |
| 리액트로 년, 연, 일 Date출력 toLocaleString 활용 (0) | 2023.02.15 |


